Four key ratios show valuation picture is a lot better than it was a month ago

Published: March 16, 2020 at 4:35 p.m. ET, By Mark Hulbert
Are stock prices now attractive enough to provide a safety net under this plunging market?I know it seems strange to be asking this question. Prior to February the debate among analysts was between those who thought the market was merely overvalued and those who considered it to be extremely overvalued.
Such concerns are so last month. The question for today is whether the market’s plunge, which has reduced the S&P 500 by as much as 30%, has not only worked off the market’s overvaluation but perhaps even made equities undervalued.
Unfortunately, we’re not there yet. But the valuation picture is a lot better than it was a month ago. Before presenting the data, I should acknowledge — as I and others have on numerous prior occasions — that valuations are not particularly helpful as short-term market timing tools. The stock market can stay undervalued for a long time before bottoming, just as it can stay overvalued for a long time before topping out (as the last several years have so amply illustrated).
When valuations become attractive enough, courageous contrarian-minded investors will step up to the plate and start buying
Still, when valuations become attractive enough, courageous contrarian-minded investors will step up to the plate and start buying — thereby cushioning the havoc wreaked by the panic selling.
When will that point be reached? First, consider another qualification about valuations in today’s market: Many of the variables on which some valuation metrics are based are shifting so fast, in unknowable ways, that little confidence can be placed in them. Take the P/E ratio, for example: There’s no way of coming up with even a reasonable guesstimate of the impact the coronavirus pandemic will have on corporate earnings. But if earnings fall just as fast as the market, the P/E will remain unchanged.
Fortunately, there are a handful of valuation ratios in which the denominator changes relatively slowly over time, enabling us with some confidence to know where they stand now. An example is the q-ratio, which was introduced by the late James Tobin, the 1981 Nobel laureate in economics. It is calculated by dividing market value by the replacement cost of assets. That cost should be more or less the same today as it was in February.
The same is true for the other three valuation ratios on which I am focusing in this column: The price/book ratio (book value changes relatively slowly), the cyclically adjusted price/earnings ratio (based on the average of 10-year inflation-adjusted earnings per share, which also changes slowly), and the Buffett Indicator (the ratio of GDP to the total value of all stocks; GDP is a lot less volatile than the stock market).
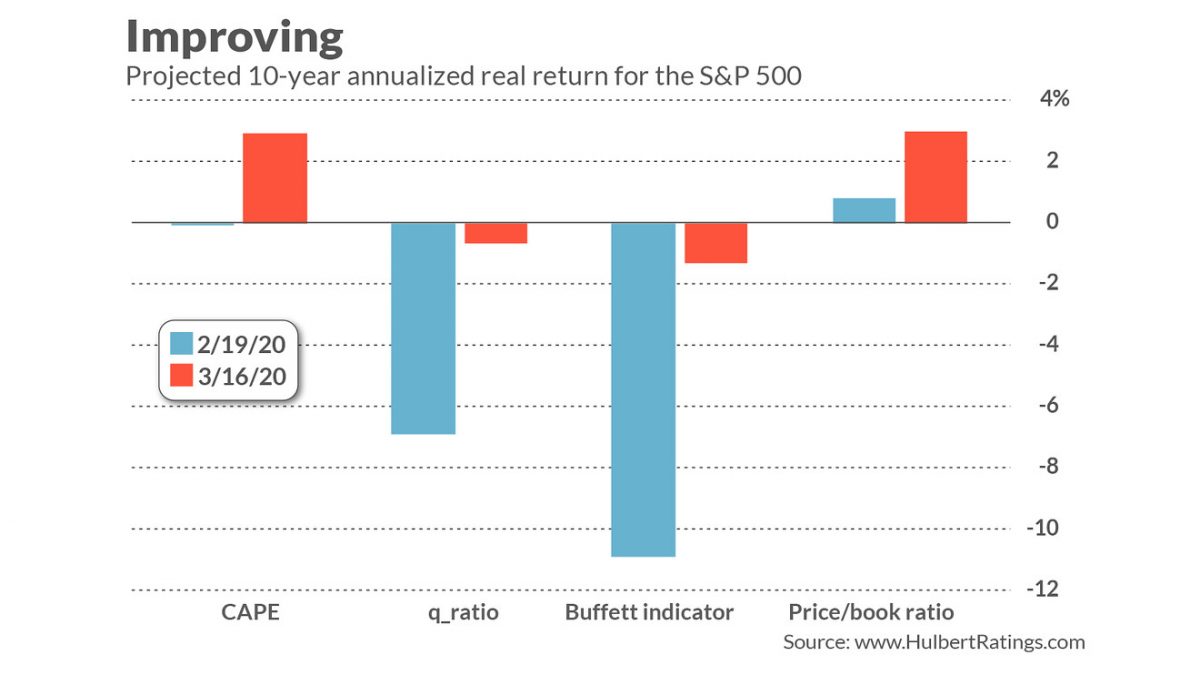
Projected 10-year returns are markedly better than they were at the February top.
To calculate how much less bearish (i.e., more bullish) these four indicators are today, relative to where they stood at the market’s Feb. 19 bull-market peak, I constructed for each an econometric model that most closely fits the relationship between its historical readings and the S&P 500’s subsequent 10-year inflation-adjusted return. I then fed into that model the indicator’s Feb. 19 reading and compared it to its current projection.
The results appear in the chart below. Notice in all four cases that the projected 10-year returns are markedly better than they were at the February top. On average, the four models are projecting a 1.0% annualized return over inflation over the next decade. Add in dividends, and you get an average projected return of around 3% annualized.

That’s significantly higher than the comparable projections for the 10-year Treasury (which are for a loss of 0.6% annualized, based on the Cleveland Fed’s calculation of expected inflation over the next decade).
That’s the good news. Unfortunately, these projected real returns over the next decade are still less than half the 6.8% annualized return the stock market has produced over the last two centuries. So it’s not clear that contrarians are ready to buy equities in a big way.
Still a projected annual return that is even modestly positive is a lot better than what fundamental analysts were projecting just a few weeks ago.
Mark Hulbert is a regular contributor to MarketWatch. His Hulbert Ratings tracks investment newsletters that pay a flat fee to be audited.
Source: www.marketwatch.com