U.S. stock market is itself a forward-looking instrument

Published: April 21, 2020 at 11:31 a.m. ET, By Mark Hulbert
The huge drop in the Index of Leading Economic Indicators (LEI) is not as bearish as it otherwise seems. I’m referring to the Conference Board’s announcement at the end of last week that its LEI index fell 6.7% in March, double the previous record of “just” 3.4% that was set in October 2008, one of the darkest months of the Great Financial Crisis. This comparison suggests that what we’re facing today is perhaps twice as awful.
That certainly seems scary, and the bears have made a big deal of it. Fortunately, the data don’t support as gloomy a scenario as many of those bears are painting.
That’s because the U.S. stock market is itself one of the best leading economic indicators. By the time the latest LEI reading is released, it doesn’t tell investors anything that isn’t already well known and widely reflected in stock prices. Don’t forget that just as the LEI fell by a record amount in March, so did the S&P 500.
Using the LEI as a stock-market timing indicator is about as helpful as driving while looking in the rearview mirror. This is not a criticism of the LEI; the Conference Board did not create the LEI to be a stock-market timing indicator and has not advertised it as such. The culprits in thinking otherwise are the stock market prognosticators who assign this meaning to the LEI without taking the trouble to analyze the historical data.
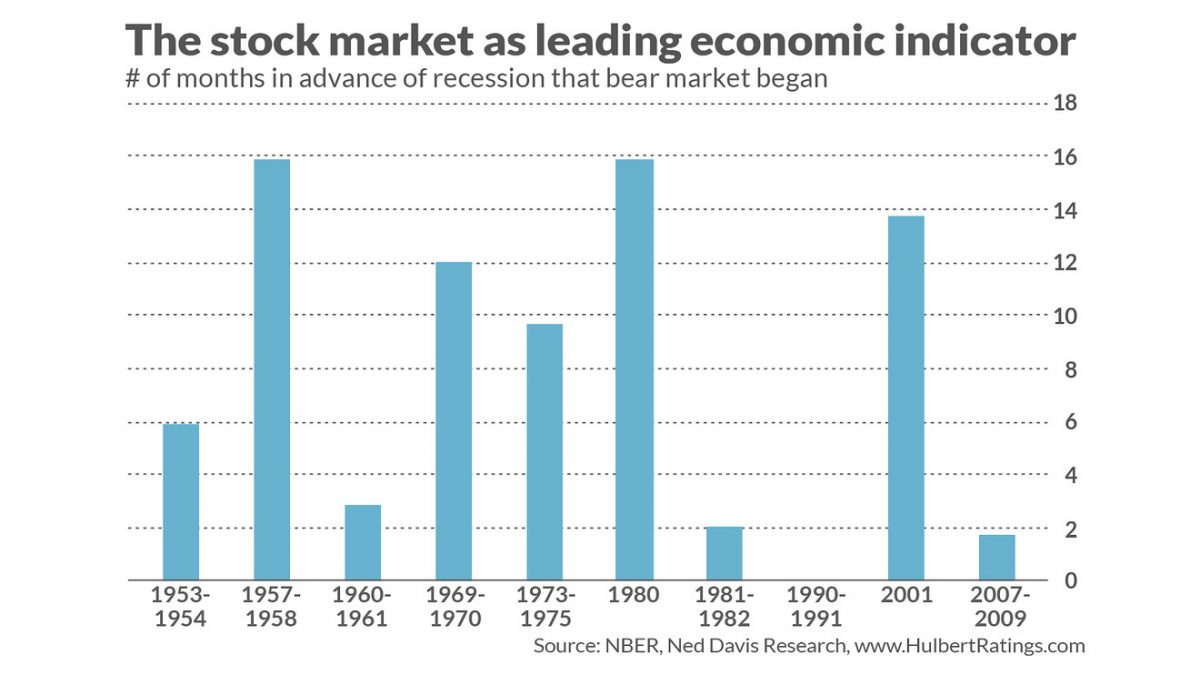
Consider the 10 economic recessions in the U.S. since 1950, per the National Bureau of Economic Research (the semi-official arbiter of when recessions in the U.S. begin and end). In nine of those 10 cases, according to the calendar maintained by Ned Davis Research, a bear market began well in advance of those recessions. The lone exception came in 1990, when both the bear market and the recession began in the same month (July). (See chart below.)

How much of a lead time have bear markets had in advance of recessions? The average across all 10 bear markets since 1950 has been 7.9 months. No wonder the Conference Board includes the stock market as one of the 10 indicators it uses to construct its LEI.
The stock market’s ability as a leading indicator has actually increased in recent years.
What is less well known is that the stock market’s ability as a leading indicator has actually increased in recent years. We see this when measuring the strength of the correlation between the stock market’s return over the trailing year and the LEI’s percentage change over that same time period. From 1959 (when the LEI was created) to 2000, the r-squared (a measure of a correlation’s strength) was a statistically significant but still modest 11%. Since 2000, in contrast, the r-squared of this correlation has jumped to 55%.
My analysis doesn’t guarantee that we’re in a bull market again, of course. The market might break below its Mar. 23 lows (Dow DJIA at 18,591.93 and S&P 500 at 2,237.40). My point instead is that, if it does so, it will be because of what happens to the economy in coming weeks rather than because of what we already know — which is already reflected in current stock prices and the LEI’s level.
The stock market is forward looking, after all. As an aside, let me ask that the bulls remember this the next time the LEI moves higher. Consistency requires that if they don’t want to interpret a drop in the LEI to be bearish, they can’t turn around and interpret a jump to be bullish.
Mark Hulbert is a regular contributor to MarketWatch. His Hulbert Ratings tracks investment newsletters that pay a flat fee to be audited. He can be reached at mark@hulbertratings.com
Source: www.marketwatch.com
Read: Warren Buffett’s favorite stock-market indicator ‘scares the bejeezus’ out of this investor
More: ?Are we overreacting to the coronavirus? Let’s do the math
Source: www.marketwatch.com